

QueensGiant maintains its own asset management fund and will make direct investments in select deals. The fund is very selective in its allocation of funds based on both the deal opportunity metrics as well as the industry and deal type niche. The fund makes only non-conflicting investments in certain fintech deals and alternative lending opportunities. QueensGiant will generally notify a firm if their capital needs fit the type of deal that the fund may consider.
The QueensGiant AM Fund Competitive Advantage
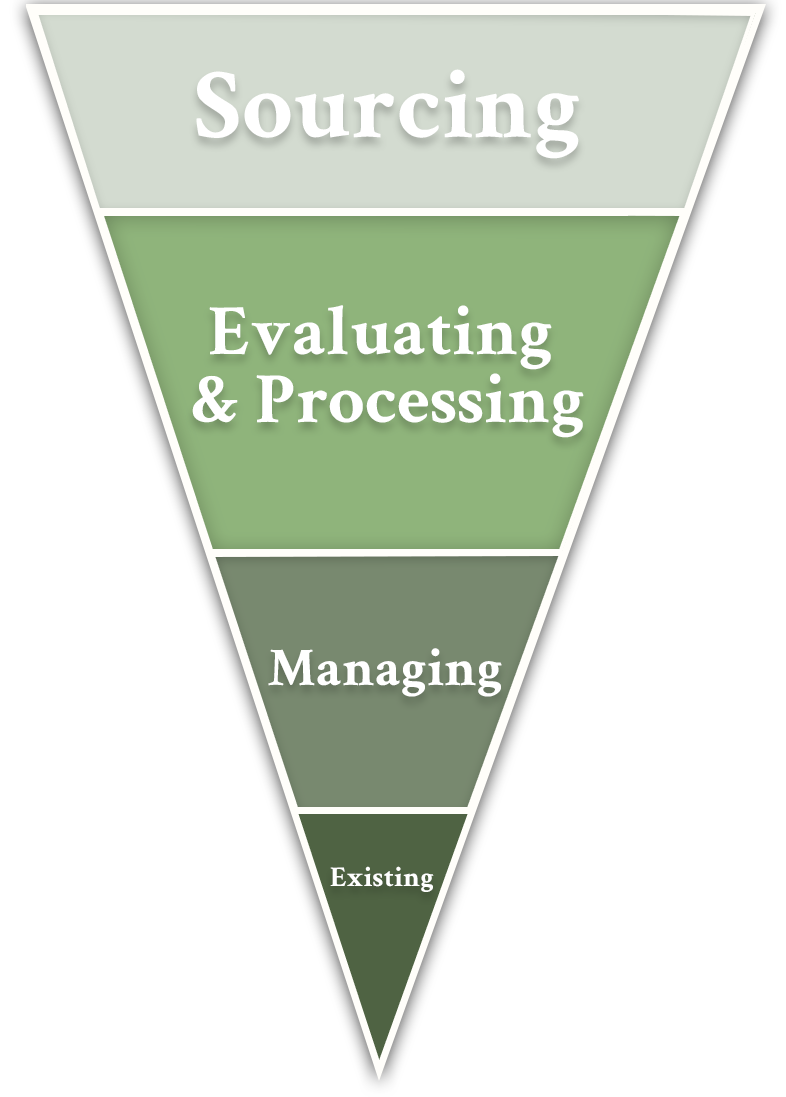
Our experienced team can independently source, evaluate, price, and structure investments
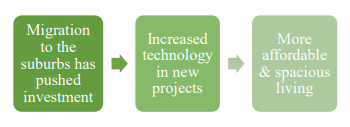
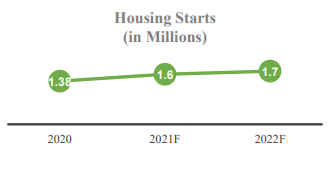
Residential & Commercial Real Estate Portfolios, Commercial
Lending and The Automotive Market
$148 Billion
Multifamily Lending Market
$1.22 Trillion
Hospitality Market
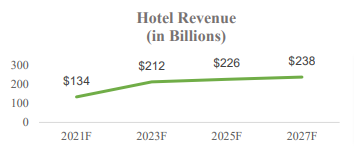
$800 Billion
Direct Lending Market
$1 Trillion
Electric Vehicle Market (2027F)
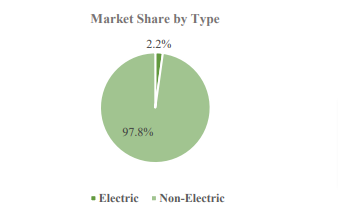
$150 Billion
Subprime Auto Market
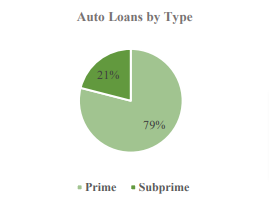
$23 Billion
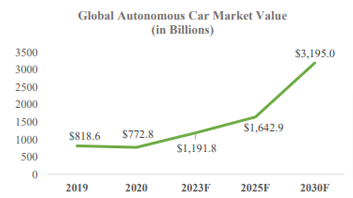
Autonomous Market
Unsecured Consumer Lending and The Fintech Market
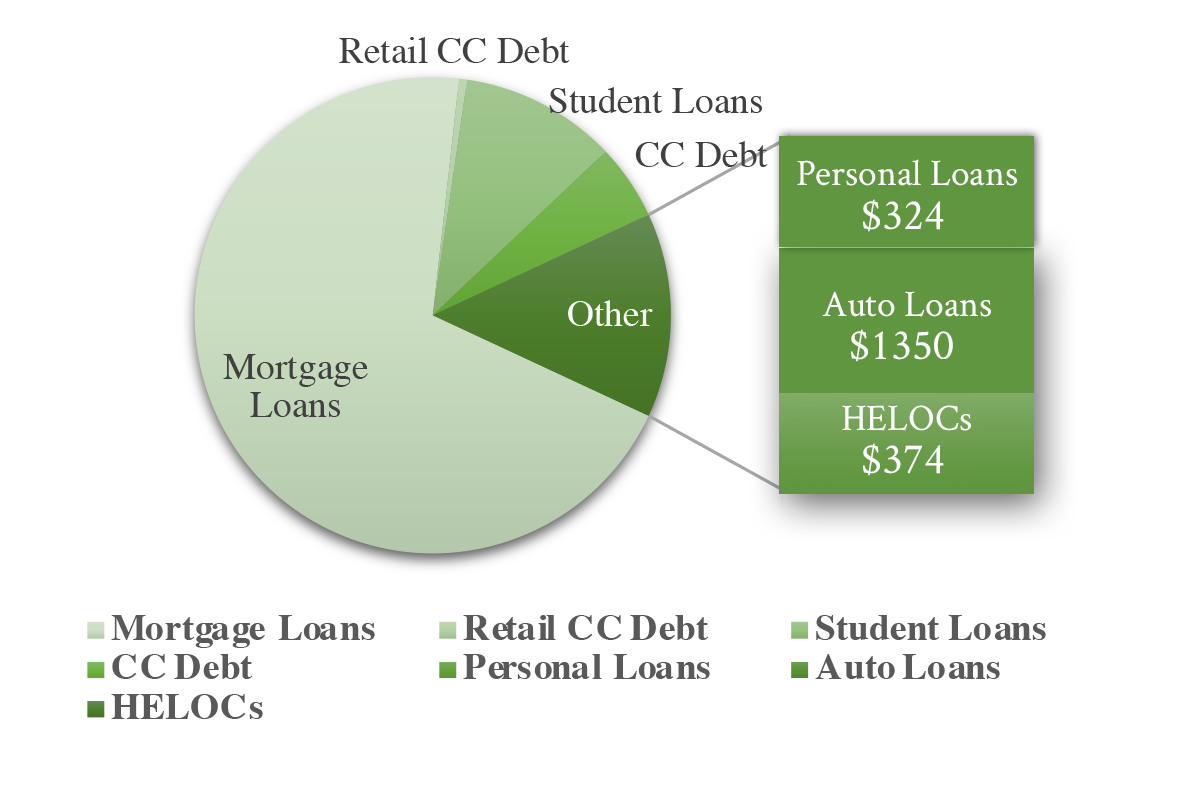
$14.88 Trillion
Consumer Debt Market
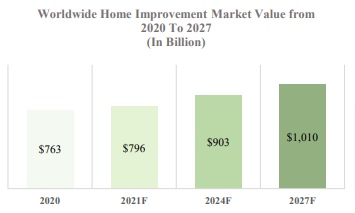
$763 Billion
Home Improvement Market
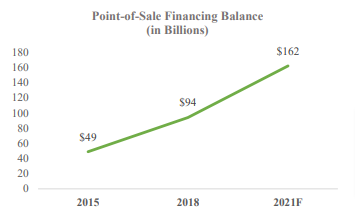
$391 Billion
Point-of-Sale Financing Market
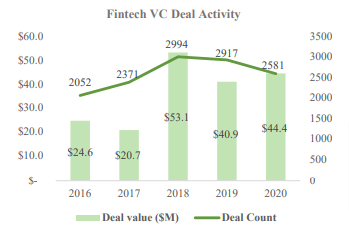
$309.98 Billion
FinTech Market (2022F)
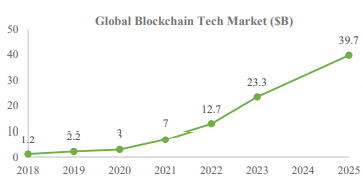
$3.67 Billion
Blockchain Market
$20.31 Billion
Digital Lending Platforms (2027F)
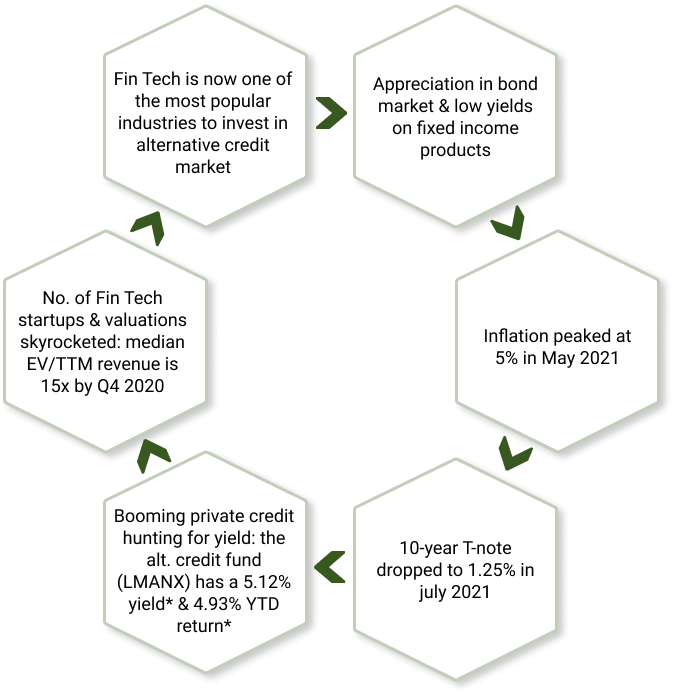
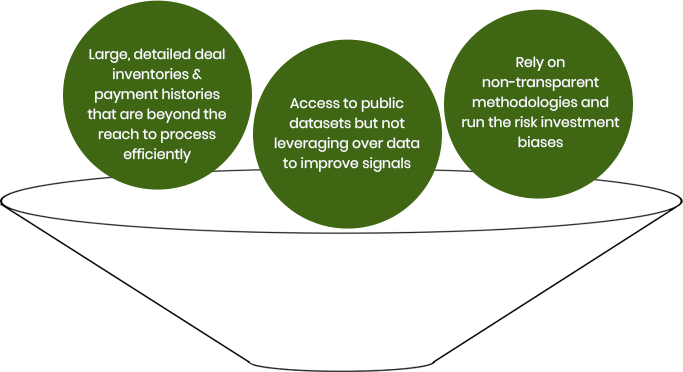
Macroeconomics Pain Points & Emerging Investments in Fintech and Alternative Credit
Macroeconomics Pain Points Lead to Emerging FinTech/Alt. Credit Investments
✓ Key Upside Rewards for Investing in Alt. Credit Industry
-
-
- Since Alt. Credit is non-market correlated, it offers a less volatile asset and adds diversification to the portfolio. Similar to other fixed income products, returns can be predictable based on the underwriting of the product
- Built-in diversification is the nature of Alt. Credit investing; it offers an investment approach different from traditional equity and fixed-income markets, and the low correlations aids in reducing portfolio volatility
- Alt. Credit investing offers higher yields than traditional investments, especially during periods of low interest rates, and loans are less vulnerable to sentiment-driven market movements than public securities, hence the strong risk-return profile
- Investing in Alt. Credit generates passive income: because of recent market actions, once illiquid markets have turned extremely liquid. This offers a strong opportunity for Alt. Credit lenders to earn a high return
- The high flexibility in Alt. Credit provides more creativity in lenders’ loan approvals, repayment terms, collateral types, and loan amounts. The types of loan offerings are vast and provide access to a broad set of investments that helps grow an investors’ total return
-
QueensGiant Data Engine
The fund utilizes an integrated solution that packages major data science systems into one application, and turns spreadsheets into a prediction pipeline overnight, securely and efficiently, offers relative value for investors

Collective Experience of the Investment Committees
Collective Transactions (millions) ~$200bn worth of deals
- Advisory $167,528
- Advisory/Capital Raise $29,598
- Capital Raise $27,564
- Capital Provider $1,898
- Advisory $167,528
- Advisory/Capital Raise $29,598
- Capital Raise $27,564
- Capital Provider $1,898
Deal Type (millions)
- Advisory M&A $118,985
- Equity Financing $48,078
- Debt Financing $31,140
- Advisory-Structured Finance $26,200
- Debt/Equity Financing $1,750
- Advisory $435
- Advisory M&A $118,985
- Equity Financing $48,078
- Debt Financing $31,140
- Advisory-Structured Finance $26,200
- Debt/Equity Financing $1,750
- Advisory $435
| Deal Type | Total Amount (in mm’s) |
|---|---|
| Equity Financing | $ 48,078 |
| Debt Financing | $ 30,615 |
| Debt/Equity Financing | $ 1,600 |
| Advisory (Structured Finance) | $ 26,200 |
| Advisory (M&A) | $ 118,985 |
| Advisory | $ 235 |
| Total | $ 225,713 |
| Sector | Amount | Type | Year |
|---|---|---|---|
| Consumer Loans | $55mm | Marketplace Lending Securitization | 2014 |
| Consumer Loans | $150mm | Marketplace Lending Securitization | 2014 |
| Consumer Loans | $100mm | Marketplace Lending Securitization | 2015 |
| Consumer Loans | $350mm | Restructuring Securities Transaction | 2015 |
| Consumer Loans | $50mm | Subprime Auto Debt Financing | 2016 |
| Consumer Loans | $75mm | Consumer Leases | Ongoing |
| Consumer Loans | $200mm | Subprime Auto Financing | Ongoing |
| Consumer Loans | $500mm | Home Improvement Lending Platform | Ongoing |
| Sector | Amount | Type | Year |
|---|---|---|---|
| SME Loans | $40mm | Term Warehouse Facility | 2016 |
| SME Loans | $500mm | Debt Financing | 2017 |
| SME Loans | $48mm | Warehouse Finance | 2020 |
| SME Loans | $150mm | SBA Credit Facility | 2020 |
| Sector | Amount | Type | Year |
|---|---|---|---|
| CRE | $65mm | Restructuring Securities Transaction | 2010 |
| CRE | $400mm | Manufactured Homes Debt Financing | 2014 |
| CRE | $45mm | Restructuring Securities Transaction | 2014 |
| CRE | $85mm | Restructuring Securities Transaction | 2015 |
| CRE | $400mm | Restructuring Securities Transaction | 2015 |
| CRE | $85mm | Hotel Debt Financing | 2015 |
| CRE | $65mm | Hotel Debt Financing | 2016 |
| CRE | $89mm | E-commerce Warehouse Financing | 2020 |
| CRE | $25mm | Manufactured Homes Senior Debt Financing | Ongoing |
| Sector | Amount | Type | Year |
|---|---|---|---|
| Residential Home Loans | $300mm | Whole Loan Sale | 2015 |
| Residential Home Loans | $350mm | Restructuring Securities Transaction | 2015 |
| Residential Home Loans | $80mm | Forward Flows | 2017 |
| Sector | Amount | Type | Year |
|---|---|---|---|
| Alternative Energy | $225mm | Project Financing | 2014 |
| Alternative Energy | $50mm | PACE Tax Equity | 2019 |
Our experienced team can independently
source, evaluate, price, and structure investments
Flexible Mandate
Backed by transparent and documented methodologies, the QueensGiant Alternative Credit & Direct Lending Fund invests across the capital structure with both debt and equity optionality across a variety of alternative asset classes and debt products
Data-Driven Strategies
Supported by high-powered and efficient data analytics capabilities utilizing the data science and machine learning competencies, QueensGiant improves upon standard investment evaluation method. This allows QG to bring economies of scale to smaller deal sizes where the risk/return profile is exceptional
Alternative Credit/Direct Lending
For origination platforms that produce assets of assorted and adaptable yield,
QueensGiant can allocate capital in the following manners:
- Senior secured loans
- Warrants, or direct equity
- Mezzanine loans
Direct Investments
QueensGiant can also engage in the direct purchase of performing credit
vehicles in the following asset classes:
- Auto debt
- Consumer Receivables
- Life Settlements/Viaticals
- Residential
- Credit Card Receivables
- Litigation Financing
- RE debt
- Equipment & Transportation Leases
- Structured Settlements
The Queensgiant Alt. Credit & Direct Lending Fund Mandate
Mandates
Potential LP Investors
Commentary
Type of Investor
- Hedge Fund
- Family Office
- Other Capital Intro Players*
- Institutional Investors
Investment Prospect
- $2M minimum investment
- Connections throughout the industry
- Seeking long term value
Benchmarking &
Fee Structuring
-
- Benchmarks will be set by the Investment Committee and will be reviewed on a monthly basis
- Goals will be set quarterly and adjusted based on current and expected performance
- Performance will be judged on the returns between the fund and each of following:
▪ Government Bond Fund (DBLDX): 2.83% yield and -8.88% YTD return
▪ Corporate Bond Fund (VBTLX): 2.09% yield and -2.69% YTD return
▪ Alternative Credit Fund (LMANX): 4.47% yield and 3.73% YTD return
▪ High Yield Fund (TNHIX): 4.98% yield and 1.48% YTD return
▪ Targeted Treynor ratio of 10, Sharpe Ratio of 2, and 700 basis point spread over the 10-year Note
- Management fee: a flat fee charged on the total AUM, deducted on a monthly or quarterly basis. It would be a flat annual fee ranging between 0.5% to 2% AUM + 1% over certain hurdle rate and are used to cover administrative and operating costs for the investment firm
- Performance fee: Any additional provisions, i.e., a high-water mark/ hurdle that gates the performance fee from distributing for poor performance. It’s usually 20% to ensure that the fund always has an incentive to deliver absolute rather than merely relative returns on investment
- 2-and-20: pays 2% management fee and 20% incentive fee, with or without any additional performance provisions, excluding all hurdles and high marks
- 1-or-30: Managers trade in their 1% management fee for a 30% performance fee of alpha when the latter is greater. This is for the manager to receive a predictable management fee while investor retains 70% of alpha
- Other alternative fee structures: Fund will take 2% of yield over certain amount, depending on the investment
Liquidity &
Leverage
▪ Lockup:
▪ Initial lockup period of 12 months. After, investors will be able to withdraw capital gains monthly/quarterly from any investment made
▪ After 24 months, principal can be withdrawn. Before this period ends, principal withdrawn would be subject to a penalty
▪ Principal cannot be withdrawn during an active investment, only during a period where capital is in a safe, liquid investment
▪ Liquidity:
▪ Idle capital will be put to work in safe and liquid vehicles between investments
▪ Such investments include T-Bills with maturities of 4, 8, and/or 13 weeks, or (non) negotiable CDs with maturities less than 3 month. Current yields are
between 1/2 and 3 basis points
▪ Each investment will be rolled over, if needed. If an investment opportunity arises and an agreement reached in advance, capital may not be rolled over
▪ Leverage:
▪ QG AM will seek to use leverage as it sees fit, but will proceed with caution
▪ Leverage will be utilized on a risk-adjusted basis – less than 2% and agreed to by all three members of the investment committee